

Summary
For the first time since mid-to-late 2022, certain public new car auto dealerships trade at seemingly cheap valuations again. The worries of the moment are declining margins for new car dealerships and higher interest rates are valid but also seem priced-in at current prices. Even under very pessimistic assumptions, investors seem able to generate an acceptable, although not excellent return. Should any of the current worries prove to be overdone, the a few of the public auto dealers look able to re-price significantly over the next few years.
This article will focus on AutoNation (AN) and Group 1 Automotive (GPI).

Industry Overview - New Car Auto Dealers
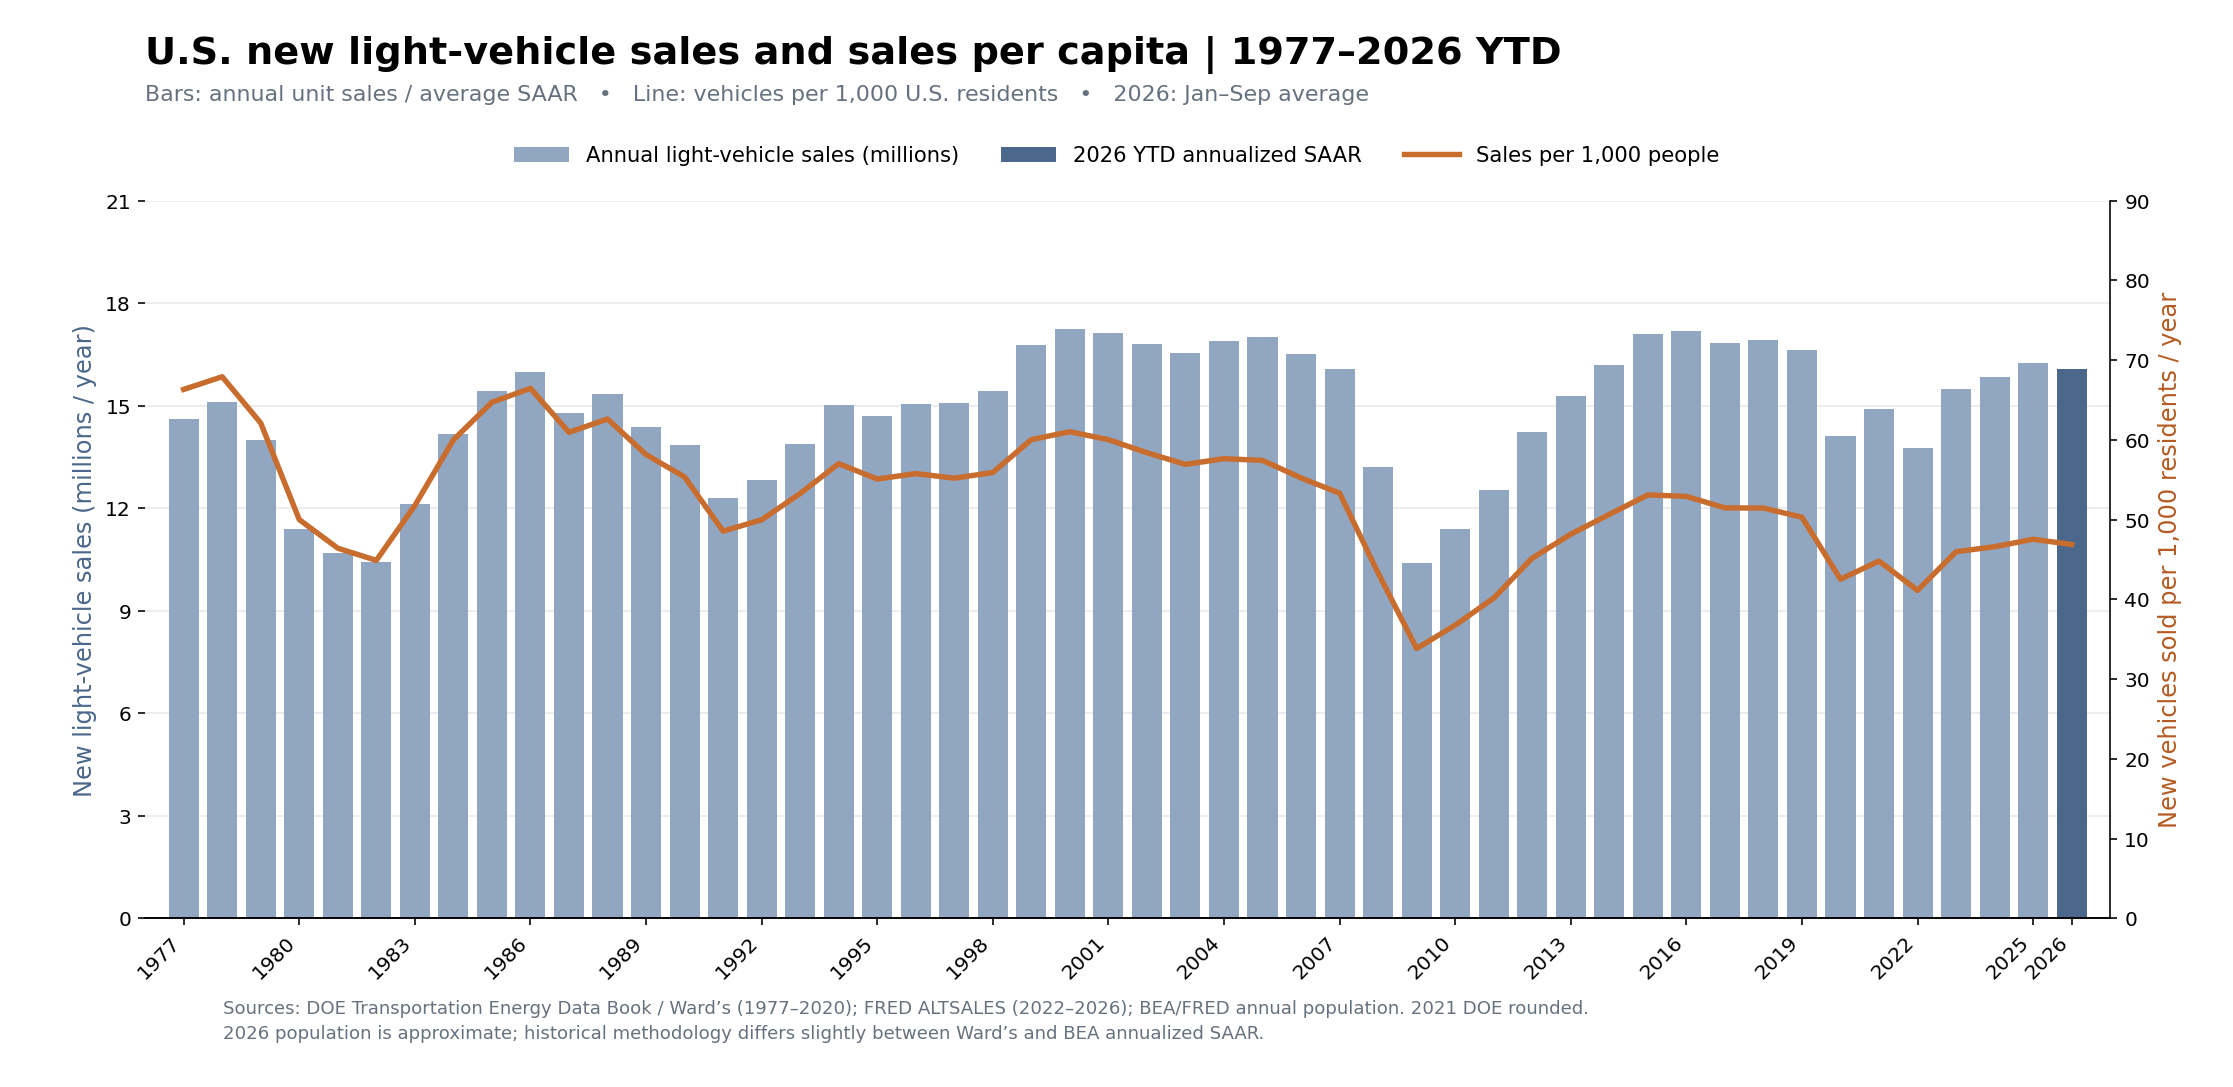
New car dealers are protected by strong franchise and state laws that effectively limit competition and in some cases operate as local monopolies of their brand. In many cases, these laws limit the manufacturers from opening a dealership of the same brand within a certain distance of an existing dealership. This dynamic is not all bad for the auto manufacturers, as it allows the dealers to more easily make the investments asked of them. More sales through a limited number of dealerships creates a stronger, more financially secure, dealership network, which benefits both parties.
New car dealers have four business lines: (1) new cars, (2) used cars, (3) parts and service, and (4) finance and insurance.
In normal economic environments, selling new cars is a low margin business, where dealers make a ~5-6% gross margin on the sale. However, those margins are worse – after considering indirect costs required to sell those new cars but not directly attributable to each individual new car sale (such as certain personnel and property costs) the margin is close to 0%.
Why sell a product that you make little to no money on? For the same reason Gillette sells it razors at no profit: large margins on the subsequent sales of razor blades from your now “built-in” customer base. New car dealers work with a similar business model, making money from new car sales in a variety of ways. First, when a new car is sold, a very high percentage of them are financed, either via a loan or a lease. When the dealer arranges the loan/lease for a customer, they are paid a commission by the finance company for the referral. Because there are minimal expenses attached to the commission it is a an extremely high margin business line for the auto dealer. Certain dealers, like AutoNation, also run their own lending department offering loans directly to their customers, allowing them to capture more lifetime profit than just an upfront 3rd party commission. Dealers also earn commissions when they sell products for insurance companies such as gap insurance.
Next, and most importantly, is the parts and service business where dealers average 50%+ margins. After a new car is sold it is typically on warranty with the manufacturer for three years. Meaning, that if any repair is required, and is covered by a warranty, the car’s manufacturer will pay their associated dealer for the cost of the repair. Once that new car is off warranty (or when they sell a used car), customers always have the option to service their car at an independent repair shop instead of a dealership. A certain percentage of customers will choose to go the non-dealership route, but certain customers will always feel more comfortable with a dealership servicing their vehicle versus the independent shop.
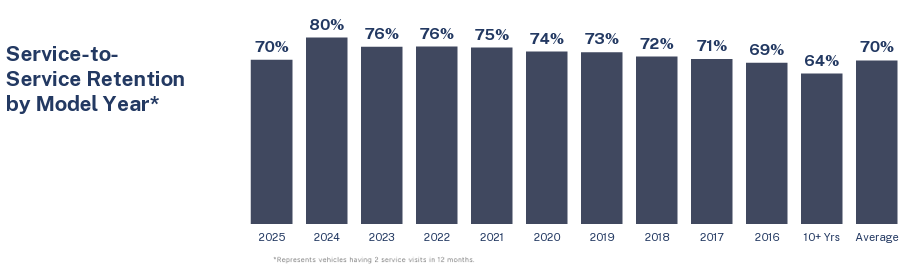
Also, even when a customer chooses to service their vehicle from an independent repair shop, they still need parts to perform the repairs. Local auto dealers act as a supplier to many independent repair and collision shops, selling them the parts they need to complete their service work.
Better yet, the service business also has limited cyclicality, with consumer demand for vehicle servicing remaining fairly stable in all economic environments. Due to this, when new car sales decline dramatically in a recession, a dealership’s service business still generates lots of cash. The service business is one of the main reasons why the public auto dealers did not lose money even during the deep recession of 2008-2009.
The service business represents a disproportionate large amount of a dealer’s profits. Although each service transaction is a much smaller dollar amount than a car sale, since the margin on that service transaction can sometimes be 10x as profitable, it requires far fewer transaction to generate the same profits.
Finally, each new car dealer operates a used car business at each dealership. Since the lowest-cost method to source used cars is from the consumer, new car dealers are especially well positioned to collect used vehicles in a variety of ways others cannot. The used car business is also less cyclical than new car sales. Industry-wide U.S. new car unit sales declined 40%+ in the Financial Crisis (from peak-to-trough), whereas used car unit sales only declined ~16%.
Variable Cost Business Model
Auto dealers, unlike auto manufacturers, operate with a highly variable cost business model. Compensation expense is by far the largest expense item in its cost structure, followed by advertising. Much of this compensation is paid to the dealer’s sales people, which comes in the form of small base compensation plus larger potential commissions. When sales decline, commissions automatically decline (less sales = less commissions). Dealer’s can also cut staff during a recession as they obviously need less sales people if they have less customers.
This dynamic combined with the ability to cut advertising expenses creates a the predominantly variable cost structure. For example, during the Financial Crisis, GPI’s revenues declined ~30% from 2007-2009. Despite this decline, operating margins only declined from 3.1% in 2007 to 2.8% in 2009. So, although revenues and profits both fell substantially during a very deep recession, GPI (and the other public dealers) still remained profitable. Profitability was only possible due to (1) the less cyclical service business being a large portion of a dealer’s profits, and (2) the ability to quickly/”automatically” pull costs out of the business once a recession begins.
Overview of Group 1 Automotive (GPI) & AutoNation (AN)
I previously wrote about GPI in-depth in late 2022 here: https://www.twentypunchinvestments.com/p/group-1-automotive-gpi
I previously wrote about AN & GPI as part of a larger auto industry article in early 2024 here: https://www.twentypunchinvestments.com/p/in-depth-industry-overview-us-franchised
My focus within this article is on GPI and AN. Both have largely been good capital allocaters in the past few years, although GPI likely overpaid in their recent Hennessy acquisition - putting a large dent in their record. All the other public auto dealers I have ongoing issues with their capital allocation with most being overly acquisitive. AN and their extreme share repurchases seem to be #1 of the auto dealers in its ability to make intelligent investments with the cash profits that dealers generate annually.
The two links above dive into more detail on both GPI and AN, and the industry at large but below I’ll outline their key differences.
Geography
AutoNation (AN) is more focused on the Sunbelt area of the U.S. (the region spanning from lower California to the Carolina’s, including everything south like Florida and Texas). This region has historically been associated with faster population growth and thus faster car registration growth.
Group 1 Automotive (GPI) has a significant presence in the Sunbelt too, especially Texas, but also has a decent Northeast U.S. presence, especially in Boston Metro and Washington DC areas. GPI also has a major presence in the United Kingdom, which they enlarged a few years ago when they purchased Inchcape’s retail automotive assets.
Finance & Insurance (F&I)
AN has historically been very strong on F&I in terms of F&I per vehicle sold compared to peers. They also acquired the auto lender CIG Financial in late 2022 and changed it into their in-house lending product. By offering to directly lend to customers, AN believes they can capture more in profits then just the 3rd party commission they receive from selling a lead to a 3rd party lender. Of course, they also take the credit risk associated with the direct lending which provides additional earnings volatility in recessionary times.
GPI differs in that they do no direct lend to customers and receive 3rd party commissions. This makes their F&I business much simpler than AN’s and also reduces the associated volatility and risk.
Used Car Sales
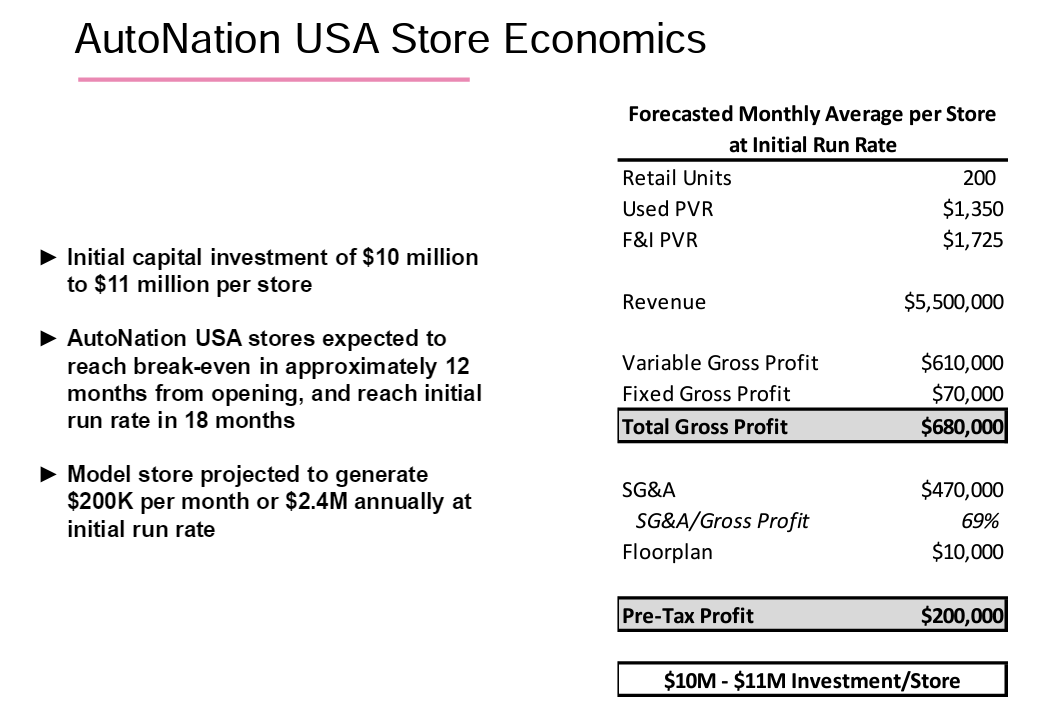
AN differs in that they have used-only stores (named “AutoNation USA”), as well as selling used vehicles via their new car dealerships. AN has slowly and methodically been building new AutoNation stores and entering new markets and are currently up to ~26 stores.
GPI intelligently realized that there is an opportunity in the used car space but they think they can utilize their existing infrastructure. In 2018, GPI introduced “Val-U-Line” used car offering which is just GPI retaining more of 6-10 year old cars instead of sending those to auction. First, this allows them to capture the margin they previously gave-up on those sales when offloading these types of cars in bulk to auctions. Also, GPI could not get the math to work on standalone used car stores so this was their version of it, allowing them to sell additional cars without additional fixed costs / infrastructure (along with their online selling portal discussed in next section). GPI believes this can also help increase the number of people coming to the dealership for service. They have stated they are not necessarily looking to sell cars to people far outside of their current markets. They want to retain their customers and gain future, higher margin, service work from them as well.
Capital Allocation
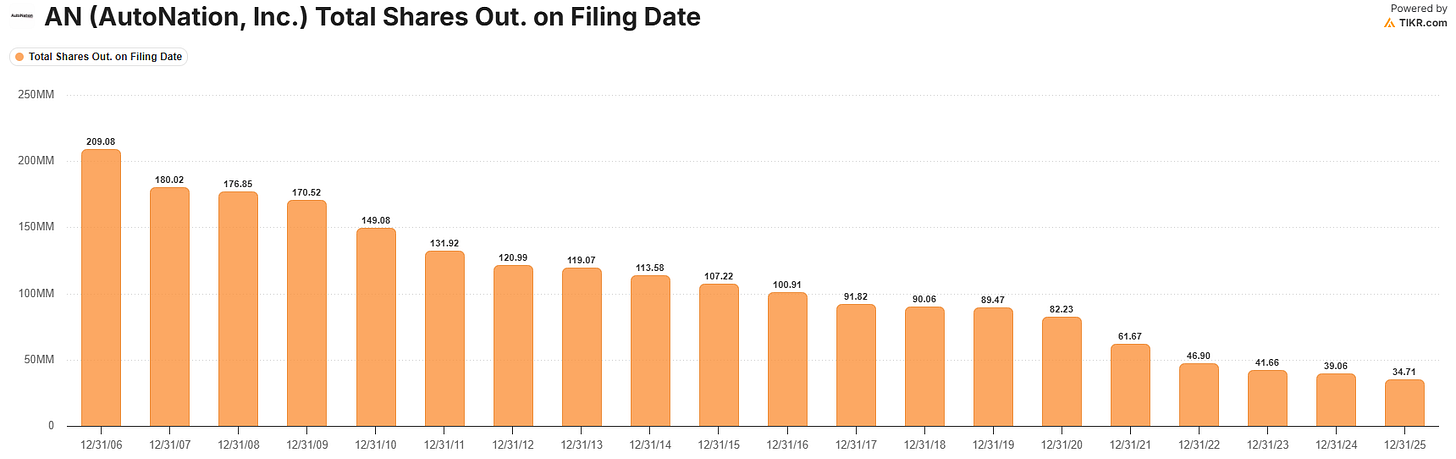
AN has heavily emphasized share repurchases historically, and has executed them especially at times of low valuations. AN has also been active in M&A, mainly pursuing additional U.S. Sunbelt U.S. new car auto dealerships. Due to AN’s historical success at repurchasing their own stock, and continued desire to do so at attractive valuations, AN is arguably much better in capital allocation than GPI.
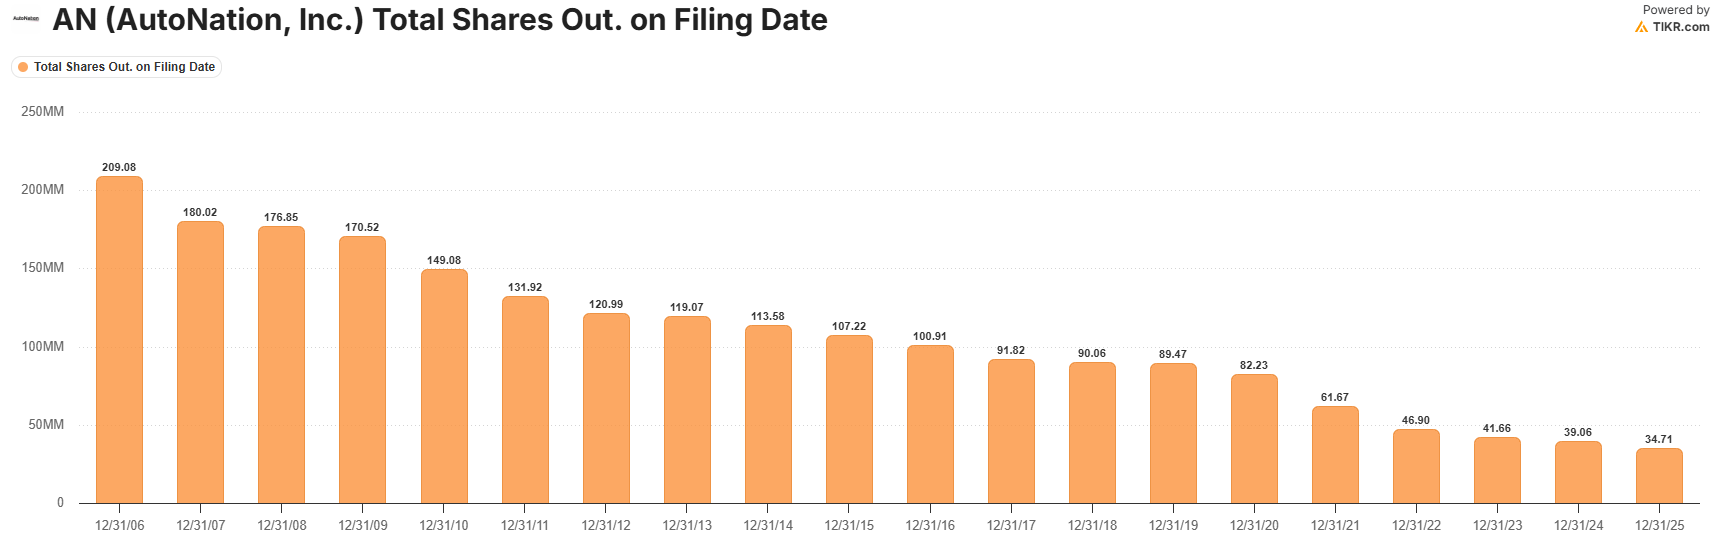
AN has repurchased ~85% of its 2006 share count over the last 20 years.
GPI seems to act sporadically as intelligent capital allocator. In the late 2010’s they began to repurchase more stock, and in a meaningful fashion. Then during COVID, GPI intelligently divested their underperforming Brazil franchise and used the proceeds, along with their COVID supply shortage earnings, to repurchase massive amounts of stock for a few years. However, they have done a bit more M&A, especially in 2026 with the seemingly very overvalued purchase of Atlanta-centric Hennessy Automobile (paying $1.3bn for $1.7bn in revenue). With Hennessy, it is hard to run even aggressive math showing that GPI was better-off buying Hennessy rather than just repurchasing their own stock.
The one recent offset is that the investment fund Conifer increased their existing stake in GPI and also was granted a seat on GPI’s Board of Directors. Conifer is run by Greg Alexander, who was supposedly named around 2010 by Warren Buffett, as one of the best investors along with Seth Klarman and Li Lu. Conifer sought out the Board seat right after the Hennessy acquisition was announced, so I would not be surprised if they wanted the Board seat to help protect their investment and nudge GPI back to more AN-like capital allocation focused on repurchases.
Incentive Structure & Management Ownership
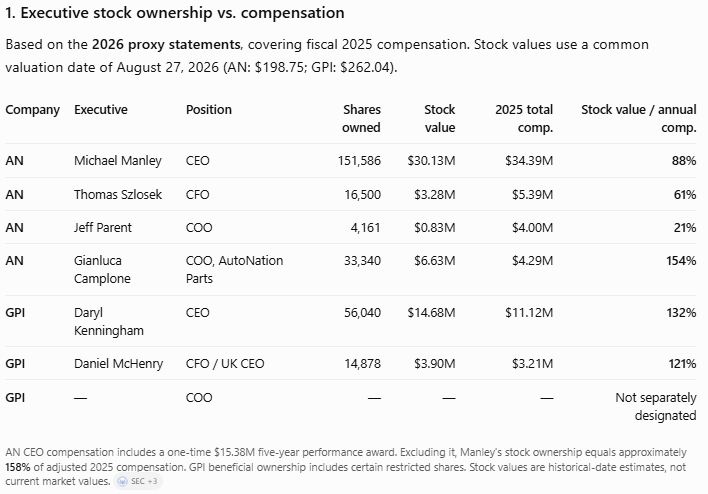
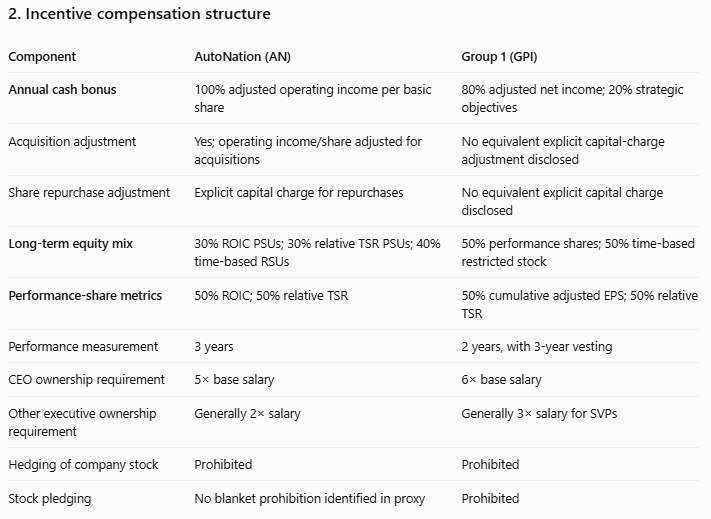
As shown in the two tables below, each AN and GPI CEO’s own approximately the same amount of stock as a percentage of annual compensation. However, AN’s incentive compensation plan seems more shareholder friendly, mainly due to it cash bonus being tied to a “per share” operating income metric as opposed to GPI’s “adjusted net income” metric. GPI’s structure creates incentives to do acquisitions without respect for paying an appropriate valuation. However, both companies utilize strong shareholder-friendly metrics in their long-term performance plans.

The Two Big Current Market Worries
Declining Growth Rates for Parts & Service (“P&S”) Business
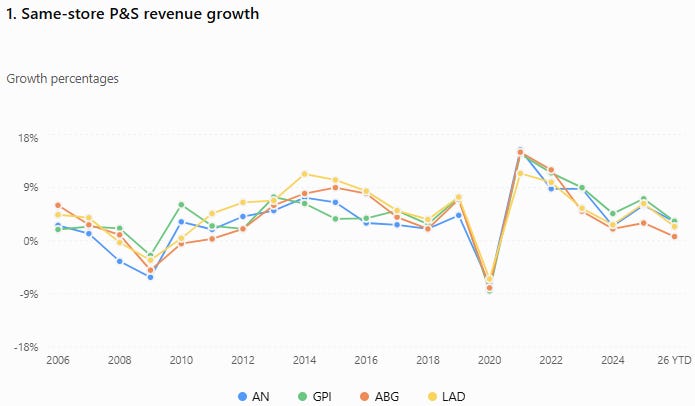
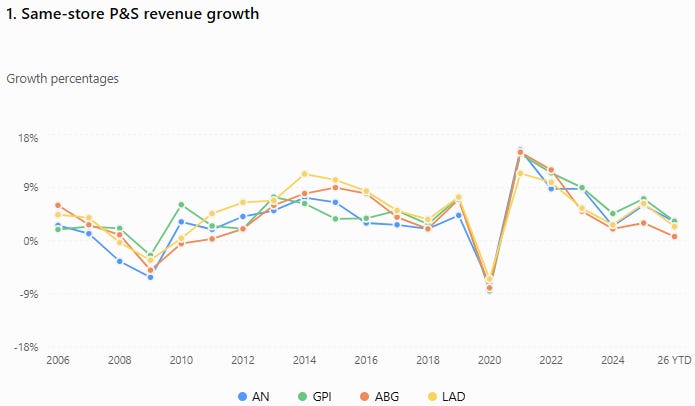
One recent market worry is surrounding slowing growth in the P&S business (see chart above). Obviously what matters is whether the slowdown is structural or simply normalization following several unusually strong years.
The automotive repair industry has historically demonstrated considerable pricing power, with repair prices consistently outpacing general inflation over the past several decades (exceeded CPI by about 0.50%/annually since 1960’s). This pricing power, combined increasingly complex vehicles, should continue supporting long-term growth.
The longer historical record is also encouraging. From 2006 through 2019 AN and GPI compounded same-store P&S gross profit at approximately 2.6% and 3.5% annually, respectively - despite included the 2008-2009 Financial Crisis. More recently, from 2016-2025, those figures increased to 5.5% and 5.3%, respectively. These results, along with the broader automotive repair inflation data mentioned previously, suggest that sustainable organic P&S growth of 3-5% annually is reasonable.
Also important to distinguish between P&S components: Customer-pay work is arguably the best indicator of underlying demand, while warranty work fluctuates with manufacturer recalls. Despite weak P&S growth in 2026, AN reported ~7% customer-pay revenue growth in 2Q26, while GPI reported ~4% growth in its U.S. customer-pay business.
Despite slowing growth to more normal growth rates, there seems to be little evidence that the industry’s long-term prospects have fundamentally changed. Normalized same-store P&S gross-profit growth of ~3-5% annually still seems reasonable, even without further margin expansion.
Full Reversion of Margins Back to ~2019 Levels
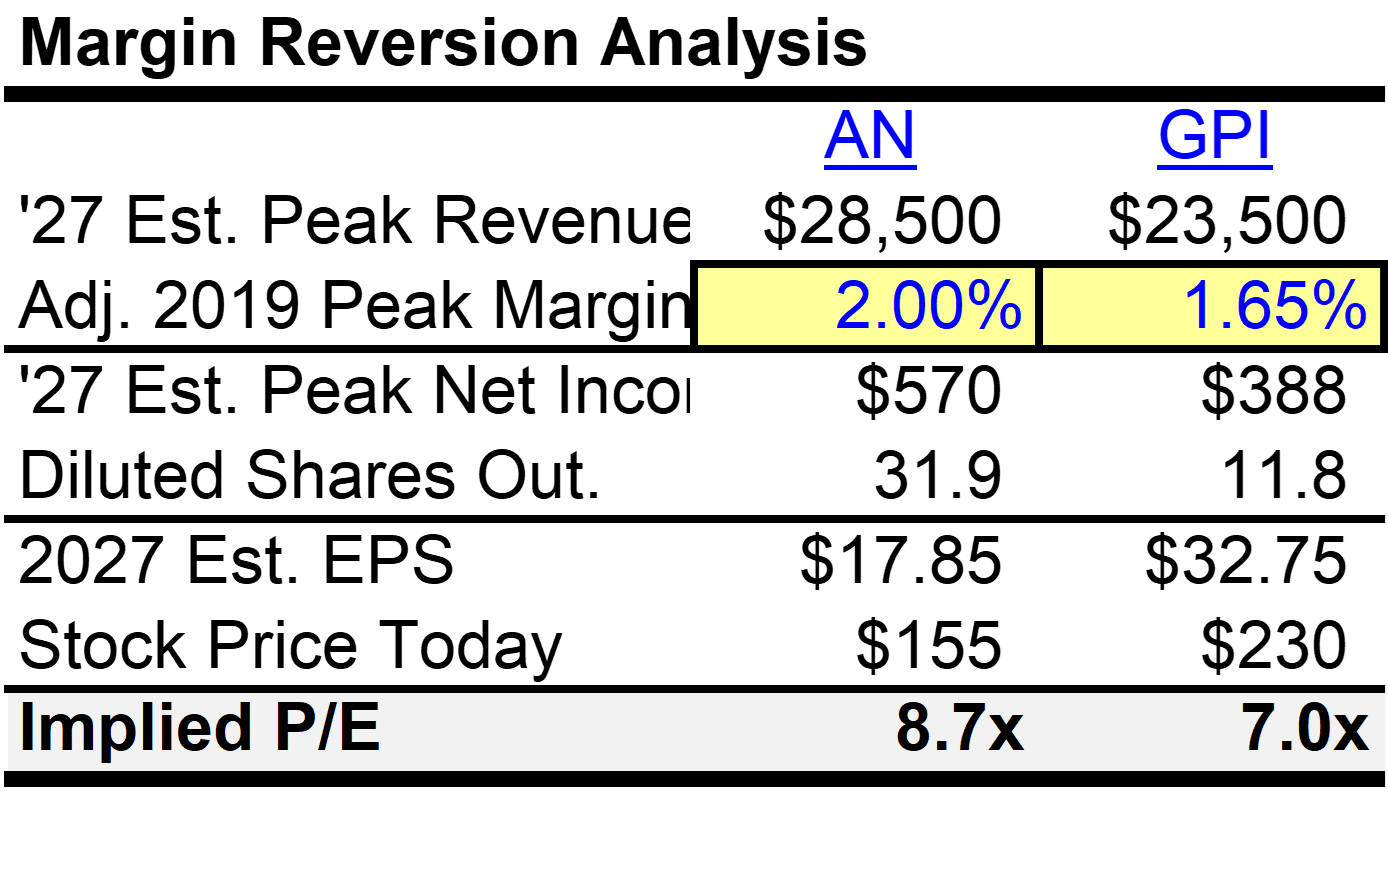
Another concern is that dealership met margins could compress/normalize further - potentially back to pre-COVID levels. While further margin compression is certainly possible, there are several reasons to believe a full reversion is unlikely.
First, new vehicle gross margins are already approaching 2019 levels. For AN, new vehicle gross margins were approximately 4.5% in 2019 versus 4.6% in qQ26. The comparison is even more interesting when including F&I income. AN’s all-in vehicle gross margin (calculated as: new+used GP + F&I, divided by total new+used revenue) was approximately 11.4% in 2019 versus 11.9% in 2Q26. GPI similarly did 10.3% in 2019 versus 10.9% in 2Q26. This suggests that much of the post-COVID vehicle margin normalization has already occurred, especially when viewed from a margin perspective that takes into account higher vehicle selling prices rather than simply comparing raw gross profit per unit figures.
Second, P&S has become an increasingly important contributor to dealership profitability. Continued organic growth (as we discussed above) in this high-margin business could help offset any remaining vehicle margin compression. Higher F&I per unit profitability and some improvements in operating efficiency also provide support.
Finally, the table above illustrates just how low the valuation of both companies are under full 2019 margin reversion scenario. Apply 2019 margin (with some small adjustments for things like GPI’s Brazil divestiture, and AN’s AutoNation Finance business), to estimated 2027 peak revenues produces EPS and corresponding PE ratios of ~9x for AN and ~7x for GPI.
These estimates suggest that a substantial amount of profitability deterioration is already reflected in current valuations. Although some additional margin compression is likely, a full return to 2019 net margins does not seem like the most probable outcome.

Valuations

Both AN and GPI are trading a seemingly very cheap valuations, especially considering their historical ability to generate profits throughout an economic cycle driven by their strong P&S business and their demonstrated ability to repurchase shares when undervalued (especially in AN’s case) and acquire additional dealerships along the way. They also trade very cheaply relative to 2016-2019, another period of stable but peak revenues.
Here are financial summaries of both of them since 2006, that bridges gross margin to “core” net margin, stripping out an unusual one-time items:
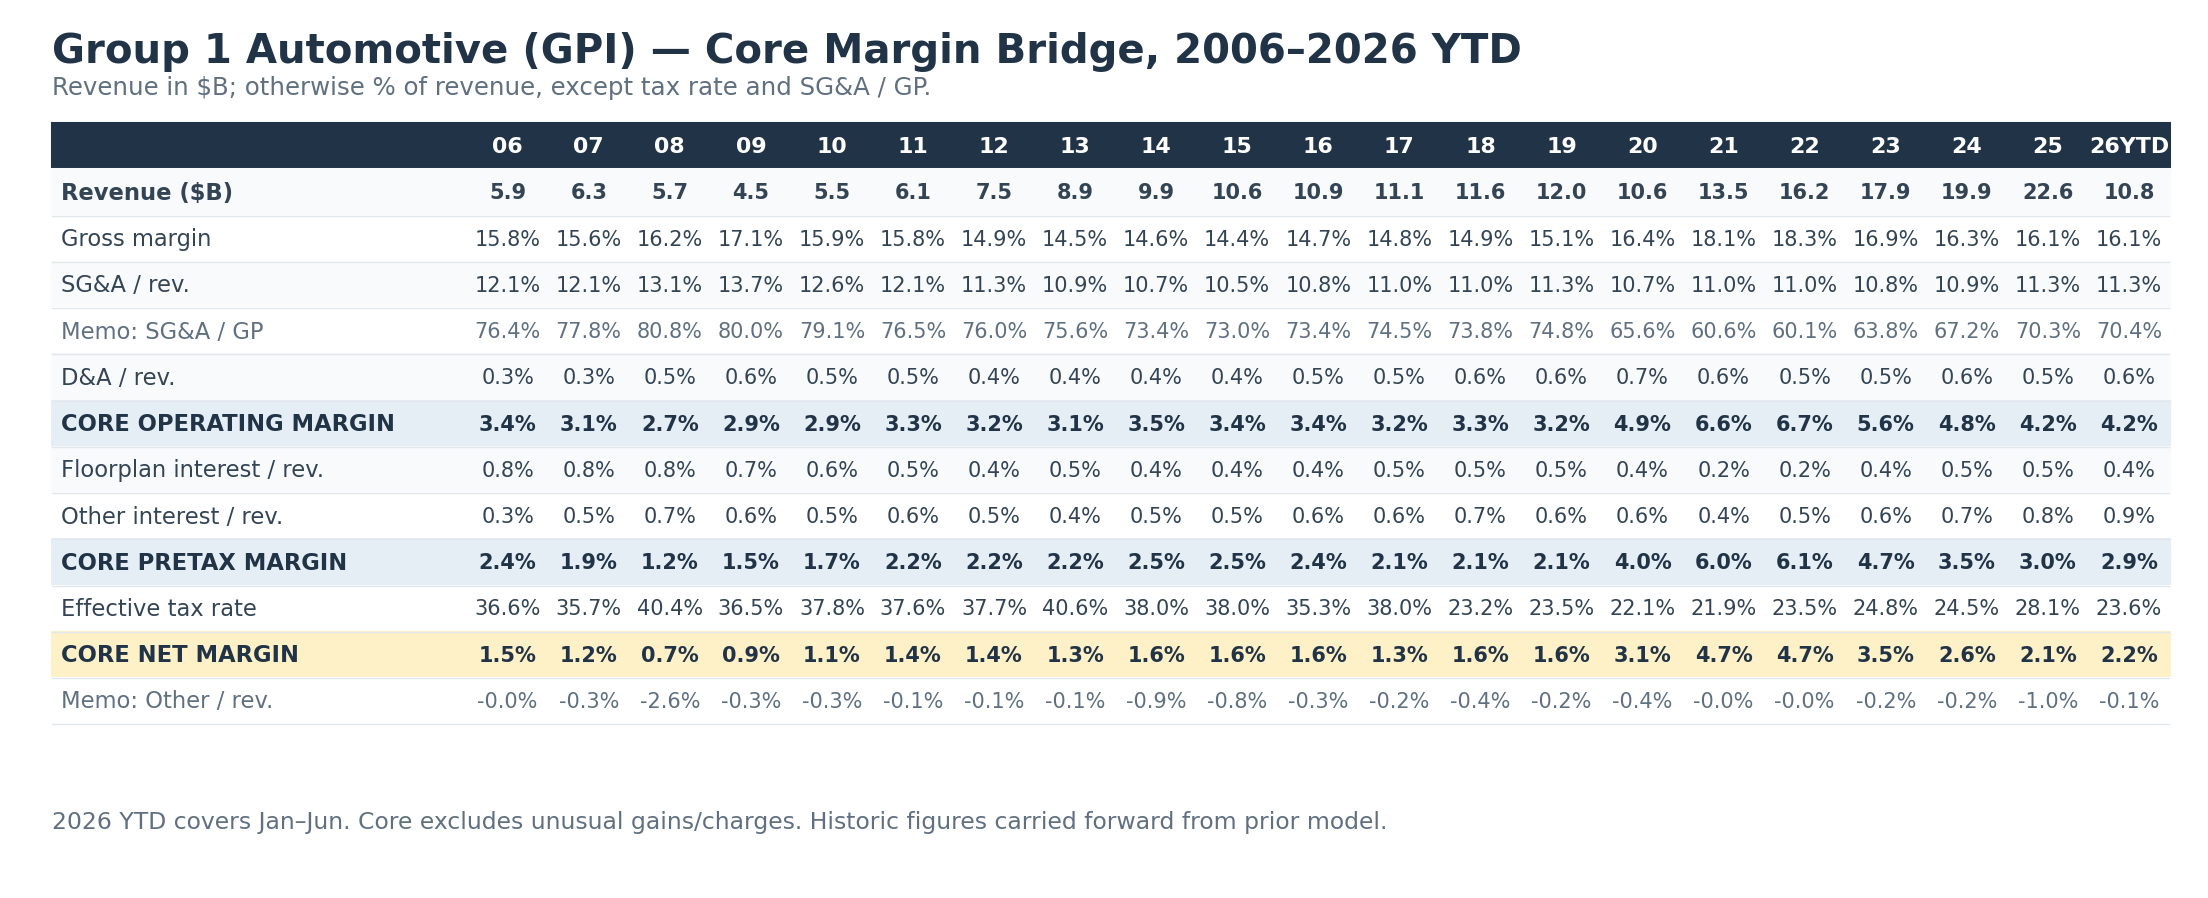
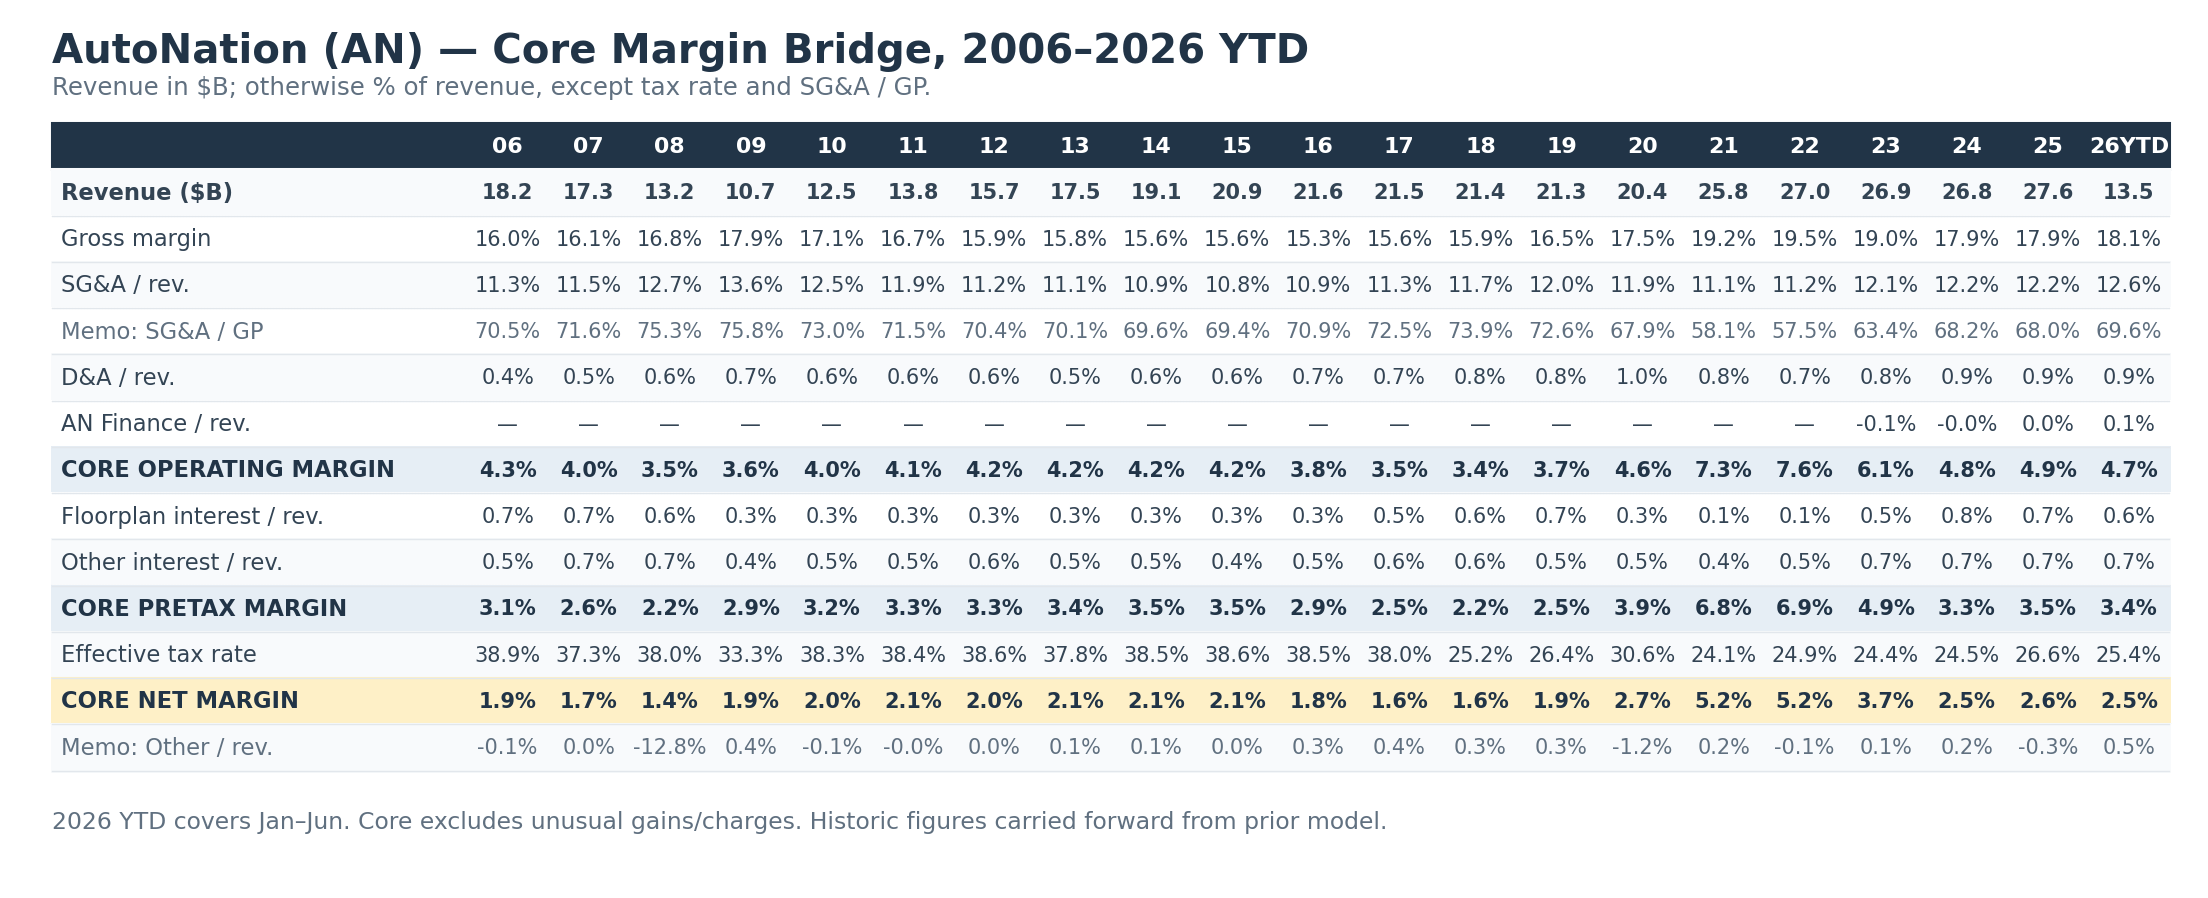
The two big questions for valuation purposes are: (1) what are normalized peak net margins, (2) what will those peak earnings be valued at.
To value the two companies, below are two simple tables showing what each could earnings in 2027 under three different scenarios. These estimates use reasonable achievable peak revenues in a assumed continued non-recessionary economic environment, combined with different assumptions for where net profit margins ultimately fully normalize to.
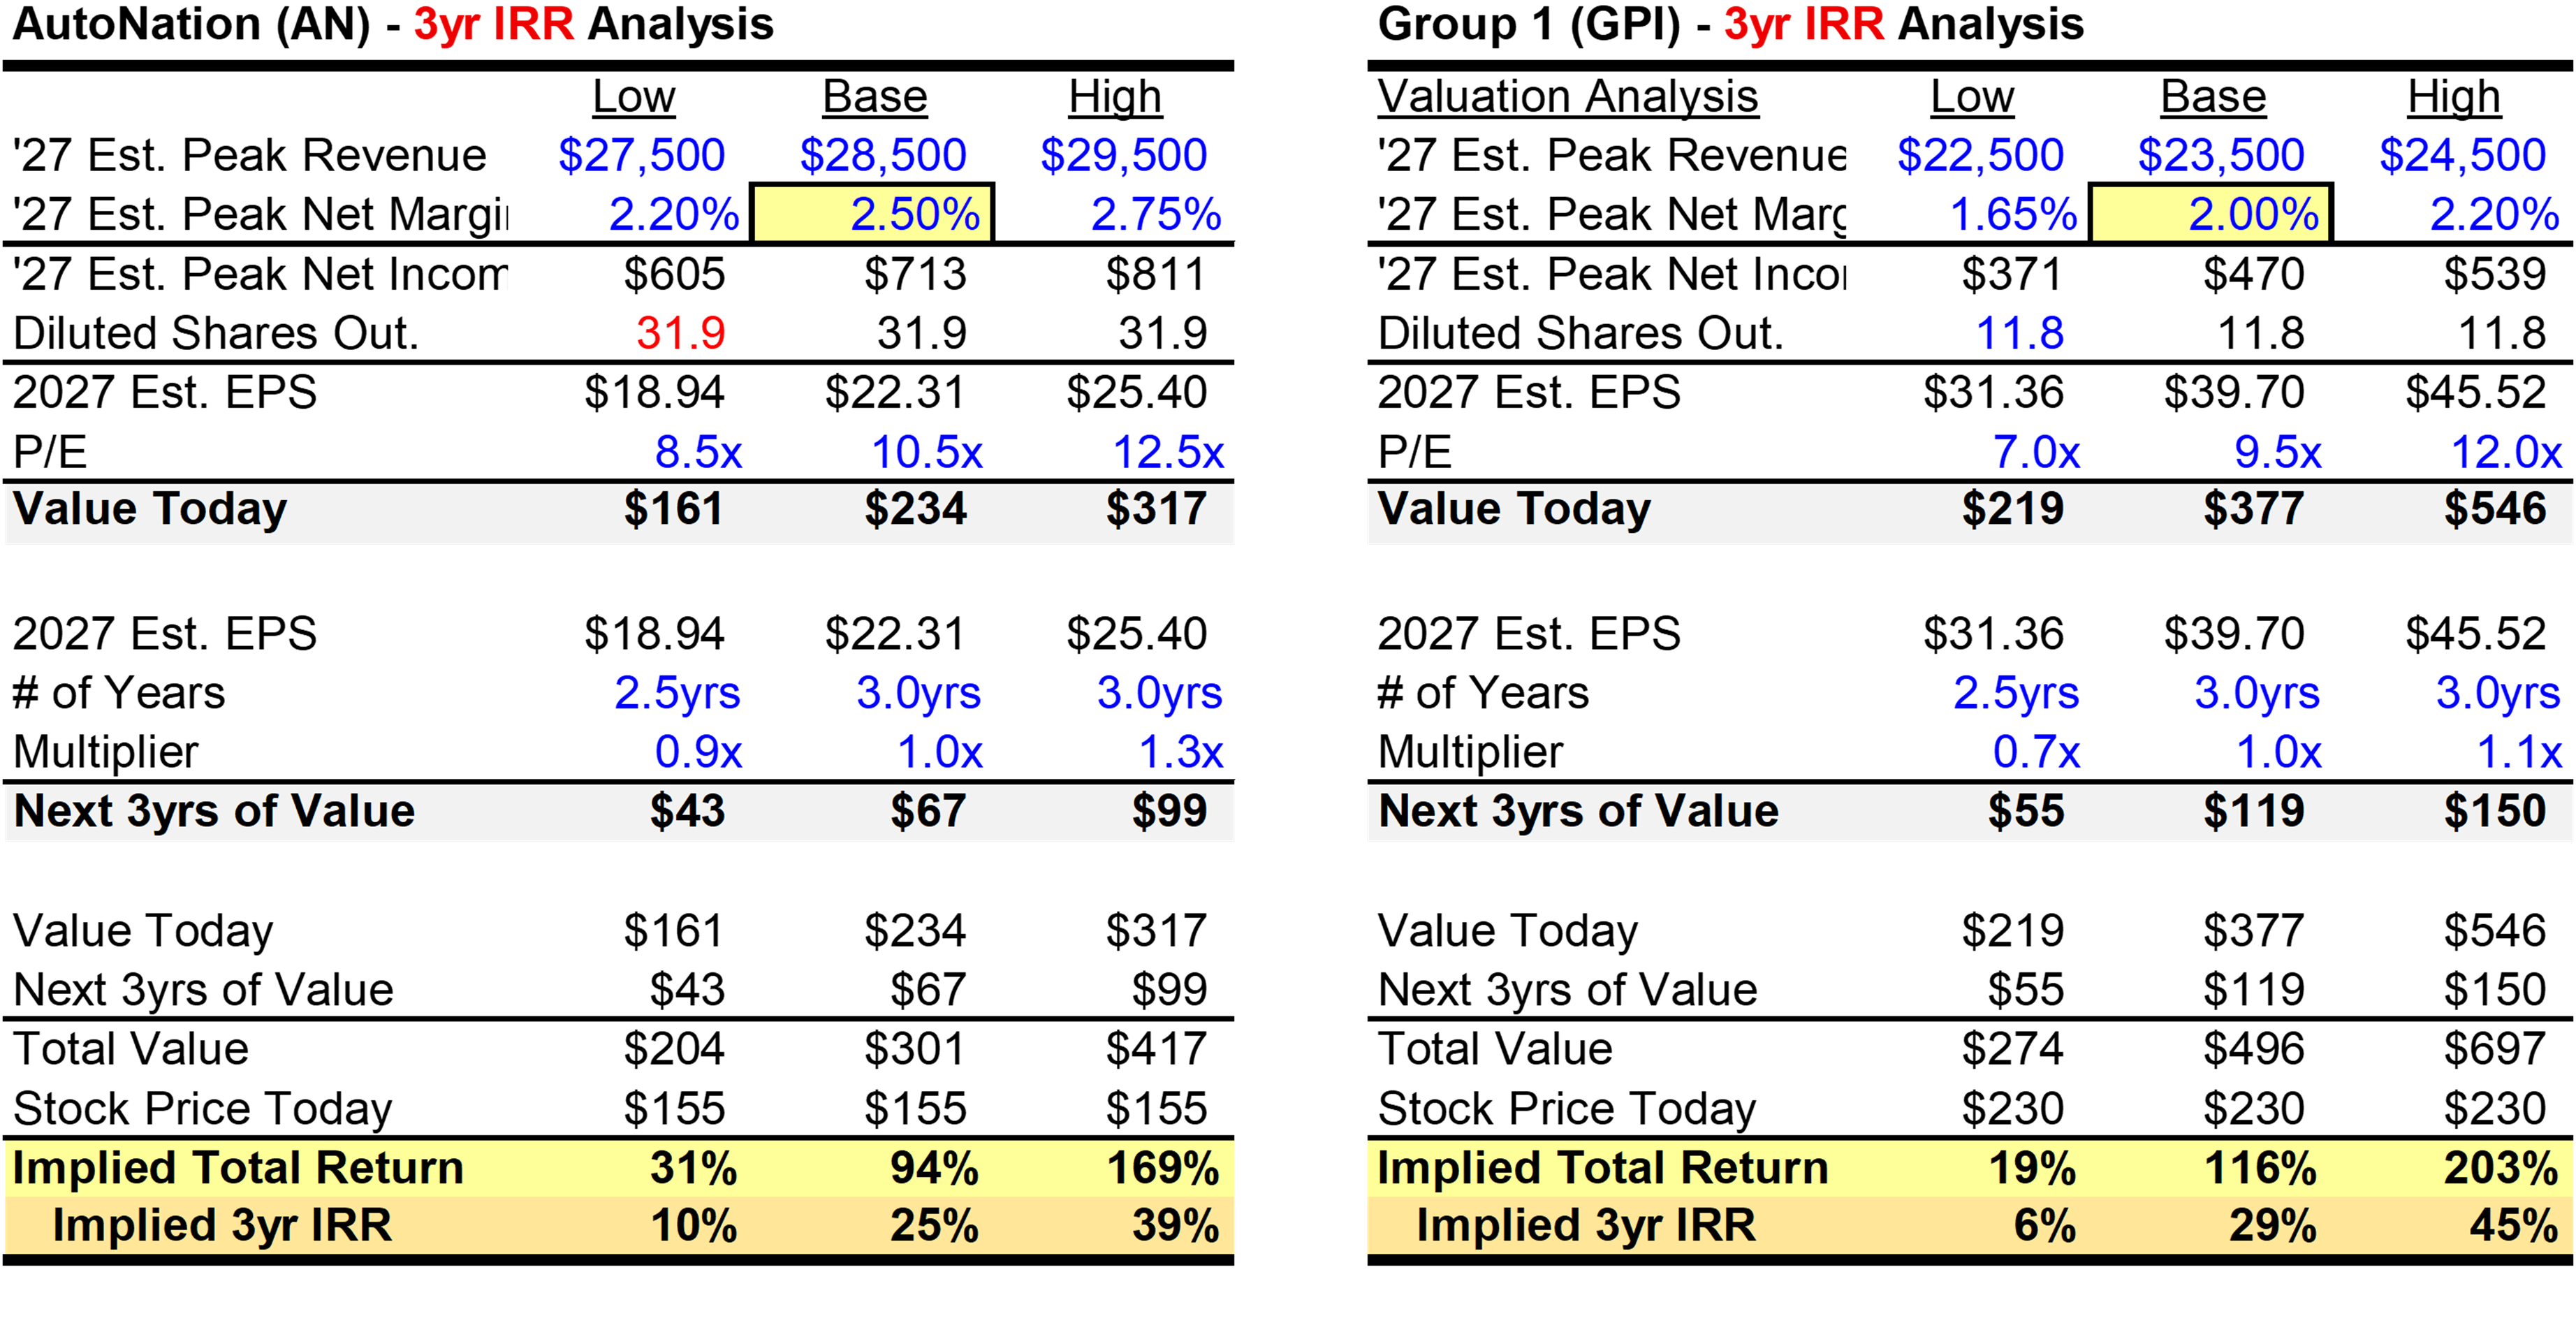
The above tables calculate a value today and a value three years from now. In the base case, the value three years from now assumes that the earnings generated are received by shareholders dollar for dollar (i.e., the 1.0x multiplier). Meaning, whether the dollars are used for share repurchases or additional acquisitions that they will be valued by the market at $1-for-$1. The other scenarios vary this multiplier with AN receiving an added benefit for their historical strong repurchases at low valuations.
The other adjustment made in the “# of Years” row is that in the “Low” case the number of years utilized is 2.5 years, instead of 3.0 years. This case in effect assumes a recession where earnings drop and therefore three years of “peak earnings” are not received (i.e., only 2.5 years).
The tables show that under non-heroic assumptions, strong three-year IRRs can be produced. And, in the event margins compress further, a recession occurs, and management teams poorly allocate capital, a still acceptable return seems to be the result. Again, these numbers are more to show a rough range of outcomes, rather than any exact precision.
A final interesting check is to consider private market value. Penske Automotive Group (PAG), with a large new car auto dealership franchise, recently announced it is being taken private at an implied ~15x-16x forward earnings. With GPI and AN trading at 6-7x forward earnings, this is a very wide valuation discrepancy. One can argue that PAG’s dealership franchise is superior with more of a luxury emphasis and that the other business lines of PAG allowed it to be acquired at a premium valuation. But, even if you apply a 20-30% discount to 15x, implying 11x-13x - that is still roughly double where AN and GPI currently trade in the public markets.
Overall, AN and GPI’s current valuations seem to be low enough that a patient investor has an interesting setup that seems to combine both low risk with a decent potential for a high return.
Disclosure: I/we currently hold shares of both GPI and AN. I/we may buy more or sell shares at any time. The above article is simply an opinion and the conclusions and underlying facts could be wrong. Please do your own due diligence before making any investment. None of my posts are investment advice. For full disclaimer, please click here. Feel free to contact me - I can be reached on Substack or via my firm’s website here.